Stress Testing With JMeter: An Overview and Example Using Lebiru.FileService 📈

It’s the night before the big debut of your online store. The clock is ticking, and every minute brings you closer to the site going live. Suddenly, the site launches, and pre-orders start flooding in! You rejoice and celebrate, until you encounter the dreaded error message: 500 Internal Server Error. Your fans can’t process orders, and the app is buckling under the spike in users. Could this disaster have been prevented?
Stress Testing is the key to ensuring your application can handle waves of requests and operations during an extended period of time. In this blog post, we will dive into what stress testing is, provide an overview of JMeter, and run a stress test against my app, Lebiru.FileService. Let’s dive in!

Ensure quality performance using stress tests!
What is Stress Testing?
Stress testing is a type of performance testing that evaluates how an application behaves under extreme workloads, such as heavy user traffic or resource utilization. It ensures the application maintains stability, functionality, and performance when pushed beyond its limits. Stress testing can reveal bottlenecks, memory leaks, and other critical issues that could hinder the app’s performance in production.
There are various types of stress tests, each designed for specific scenarios:
- 🛠️ Run-to-Failure Test: This test pushes the application until it fails, helping identify the breaking point and critical weak spots.
- 💧 Soak Test: This checks the application’s performance under sustained heavy load over an extended duration, ensuring long-term reliability.
- 📈 Spike Test: This test assesses how the application handles sudden spikes in user traffic.
Why is Stress Testing Important?
Stress testing plays a critical role in software development by ensuring that applications can handle real-world scenarios. It helps identify vulnerabilities that might otherwise go unnoticed in standard testing environments. With stress testing, developers can:
- Improve Stability: Identify and fix bottlenecks, ensuring the application can handle high demand.
- Enhance Scalability: Determine the capacity limits and plan for scaling resources accordingly.
- Boost Confidence: Gain assurance that the application will perform reliably under heavy loads.
Stress tests typically involve software developers, QA engineers, and system administrators. They are conducted in staging or pre-production environments that closely replicate the production setup to provide accurate results.
JMeter: The Defacto Stress Testing Open Source Tool
Apache JMeter, currently at version 5.6.3, is a powerful open-source tool for stress testing. It simulates heavy user traffic and measures the performance of web applications under load. JMeter is widely used for its flexibility and ability to test various protocols such as HTTP, FTP, and JDBC.
Apache JMeter
How to Download and Install JMeter on Windows
-
Download JMeter
-
Visit the official JMeter website: Apache JMeter Download Page.
-
Under the Binaries section, click the link for the latest
.zipfile to download the JMeter package.
-
-
Install JMeter
-
Extract the downloaded
.zipfile:- Right-click the file and select Extract All.
- Choose a folder (e.g.,
C:\apache-jmeter) to extract the files.
-
Navigate to the extracted JMeter directory (e.g.,
C:\apache-jmeter-x.x).
-
-
Set Up Java (Prerequisite)
-
Check if Java is installed:
java -versionIf Java is not installed, download and install the latest Java Development Kit (JDK).
-
Set the
JAVA_HOMEenvironment variable:- Open the Start Menu, search for Environment Variables, and select Edit the system environment variables.
- In the System Properties window, click Environment Variables.
- Under System variables, click New and set:
- Variable Name:
JAVA_HOME - Variable Value: Path to your Java installation (e.g.,
C:\Program Files\Java\jdk-x.x.x).
- Variable Name:
- Click OK to save.
-
-
Run JMeter
-
Navigate to the JMeter
bindirectory (e.g.,C:\apache-jmeter-x.x\bin). -
Double-click the
jmeter.batfile to start JMeter. -
Optional: Run JMeter via Command Line:
jmeter.bat
-
-
Verify the Installation
Once JMeter starts, you should see the JMeter GUI. From here, you can begin creating and running your tests.
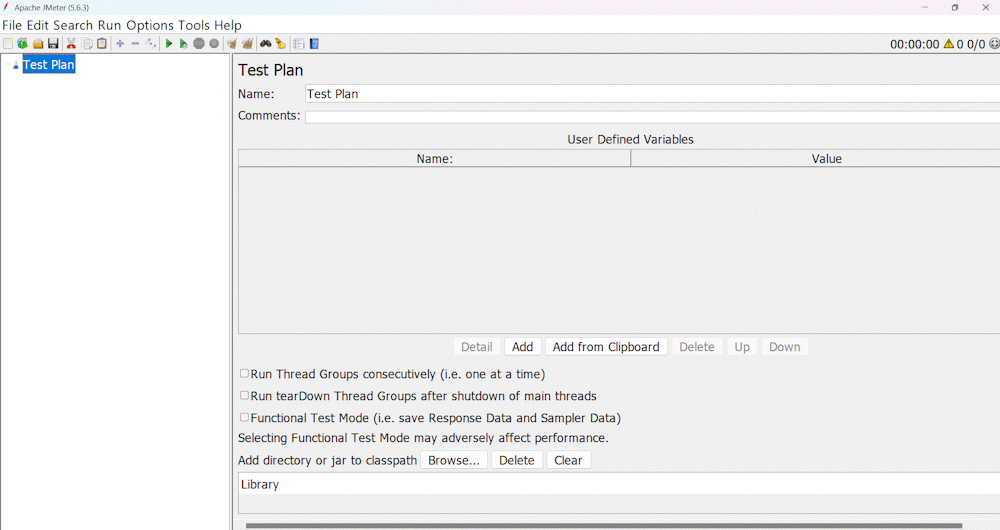
This is the opening GUI when running JMeter
JMeter Components Overview
JMeter components are the building blocks of a performance test plan, each serving a specific purpose in defining and executing tests. From configuring user behavior to collecting and analyzing test results, these components work together to simulate real-world scenarios and measure application performance effectively.
Configuring a JMeter test is straightforward using its UI. Navigate to File > New to create a new test plan, then add components via Right-click > Add > Threads (Users) > Thread Group, and so on. Each component’s settings can be adjusted via the properties panel.
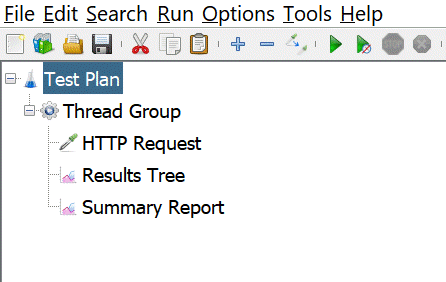
JMeter Components: Test Plan, Thread Group, HTTP Request, Results Tree, Summary Report
Let’s explore five key JMeter components and their roles in creating robust test plans.
Test Plan
A JMeter test plan outlines the testing workflow, defining the actions to be performed during the test. It serves as the blueprint for all test configurations and components.
Thread Group
The thread group defines the number of virtual users (threads) and the test’s duration. By configuring the thread count, ramp-up period, and loop count, you can simulate different user loads.
HTTP Request
The HTTP request sampler specifies the requests to be sent to the server. You can configure parameters such as the endpoint URL, request method (GET, POST, etc.), and payload.
View Results Tree Listener
The View Results Tree Listener provides a detailed log of each request and response during the test. It’s useful for debugging and analyzing specific transactions.
Summary Report Listener
The Summary Report Listener provides an aggregated view of test results, including metrics like response time, throughput, and error rate.
JMeter test plans are saved as .jmx files, allowing them to be version controlled and edited as plain text. This makes it easy to collaborate and automate testing workflows.
JMeter Stress Test Sample #1: Lebiru.FileService Homepage
Pre-requisite: Ensure Java is installed on your machine. Download Java here.
Pre-requisite: Ensure Docker is installed on your machine. Download Docker here.
Pro-tip: Clone the repo from GitHub to easily follow along. Clone repo here.
Test Goal #1
The goal of this exercise is to assess how well Lebiru.FileService app’s homepage endpoint handles volume. By running the docker image of Lebiru.FileService and navigating to the URL http://localhost:3000/File/Home on your computer, you will be greeted with the homepage for Lebiru.FileService.
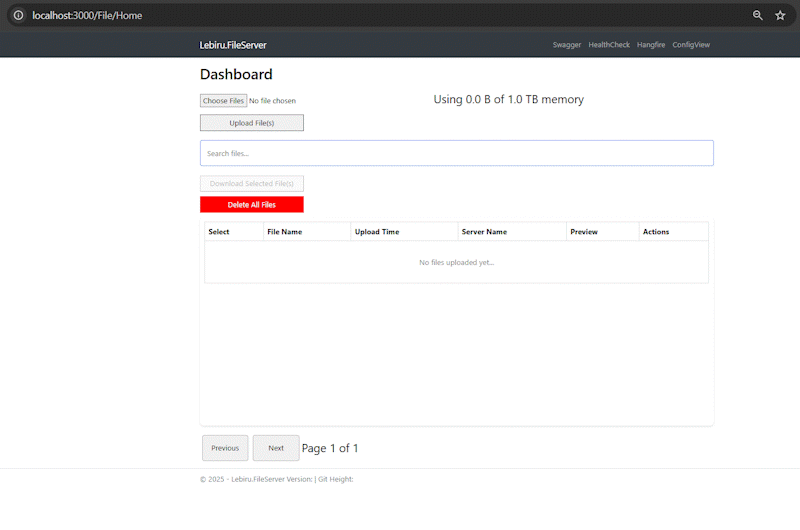
Lebiru.FileService Homepage
- Navigate to
jmeter-stress-examplerepository and run the following bash command:
This runs Lebiru.FileService on your server by pulling the latest docker image and runs the container using Docker. You should be able to navigate tobash run-lebiru-fileservice.shhttp://localhost:3000/File/Homeand see the homepage. - Open the file
Test Plan #1 - Lebiru.FileService HomePage.jmxusing JMeter to see the populated JMeter Components on the left side. - Now click the big green button near the center of the button toolbar on the top to run the JMeter test.
As the JMeter test executes, you will able to see live metrics being updated in "Results Tree" and "Summary Report". After 5 minutes the test should end and give the overall metrics of the test in the "Summary Report" view.
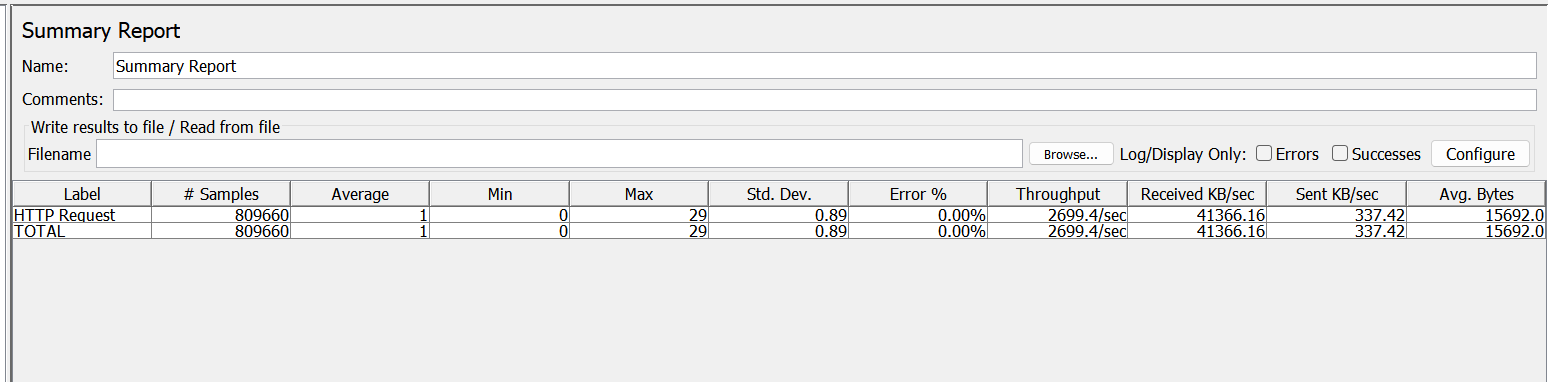
Summary Report of Test Scenario #1
Test Goal #2
The goal of this exercise is to evaluate how well the Lebiru.FileService file upload endpoint manages under concurrent user file upload.
We will upload a chibified version of my cat, Filfil, to Lebiru.FileService. Want to chibi-fy your own photos? Use my AI agent Chibify-Me!
- Navigate to
jmeter-stress-examplerepository and run the following bash command:
This runs Lebiru.FileService on your server by pulling the latest docker image and runs the container using Docker. You should be able to navigate tobash run-lebiru-fileservice.shhttp://localhost:3000/File/Homeand see the homepage. - Open the file
Test Plan #2 - Lebiru.FileService CreateDoc.jmxusing JMeter to see the populated JMeter Components on the left side. - Ensure the component "HTTP Request" is referencing the image in the repo
filfil-by-chibify-me.png - Now click the big green button near the center of the button toolbar on the top to run the JMeter test.
As the JMeter test executes, you will able to see live metrics being updated in "Results Tree" and "Summary Report". Try also navigating to the homepage and see the dashboard update with multiple file images of Filfil. Isn't that cool? After 1 minute the test should end and give the overall metrics of the test in the "Summary Report" view.
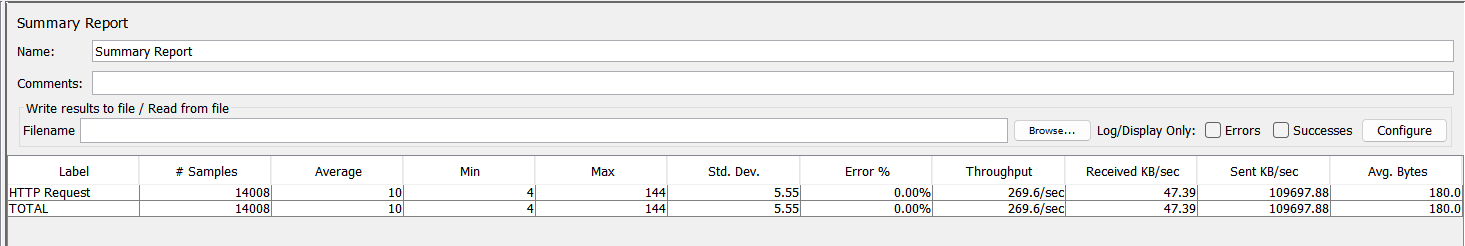
Summary Report of Test Scenario #2
Stress Testing Results
Below are the metrics my server was able to reach when running the two test scenarios. Seeing this gives us a confidence boost knowning that Lebiru.FileService is able to handle stress volumes!
| Run | Details |
|---|---|
| HomePage Test |
# Samples: 809,660 Average (ms): 1 Min (ms): 0 Max (ms): 29 Std. Dev (ms): 0.89 Error %: 0.00% Throughput (requests/sec): 2,699.4 Received KB/sec: 41,366.16 Sent KB/sec: 337.42 Avg. Bytes: 15,692.0 |
| CreateDoc Test |
# Samples: 14,008 Average (ms): 10 Min (ms): 4 Max (ms): 144 Std. Dev (ms): 5.55 Error %: 0.00% Throughput (requests/sec): 269.6 Received KB/sec: 47.39 Sent KB/sec: 109,697.88 Avg. Bytes: 180.0 |
Let’s Wrap It Up
Stress testing is an essential practice for ensuring your application’s reliability under heavy load. Using JMeter, we successfully tested the Lebiru.FileService app’s homepage and file upload endpoints, confirming their stability under defined conditions.
Have you tried stress testing before? Share your experiences and favorite tools in the comments below!